Case study
Sales dashboard for a medical and dental products distributor
- Client
- Medical and dental products distributor.
- Project
- Sales dashboard ("Intelligence Center")
- Period
- August to October 2026
- Status
- In production since October 2026
- Partnership
- Second project underway: route planning, delivery tracking, and inbound logistics and order picking
- Users
- Leadership and sector supervisors
- Technology
- Next.js, React and TypeScript; SQL Server; cloud hosting
- Indicators14 in the contract, all delivered

- Screens7 with period, unit and sector filters

- Automated tests800+ check the code on every change

- Refresh rate15 days → real time was the gap between reports; now the numbers are always current

The distributor's sales data was scattered, with no single place to follow sales, customer portfolio and targets. Every two weeks, a BI professional gathered the data and built a report; in between, leadership made decisions without up-to-date numbers. Leadership wanted a view of the whole company, and each supervisor needed to see their own sector without access to the others.
What we built
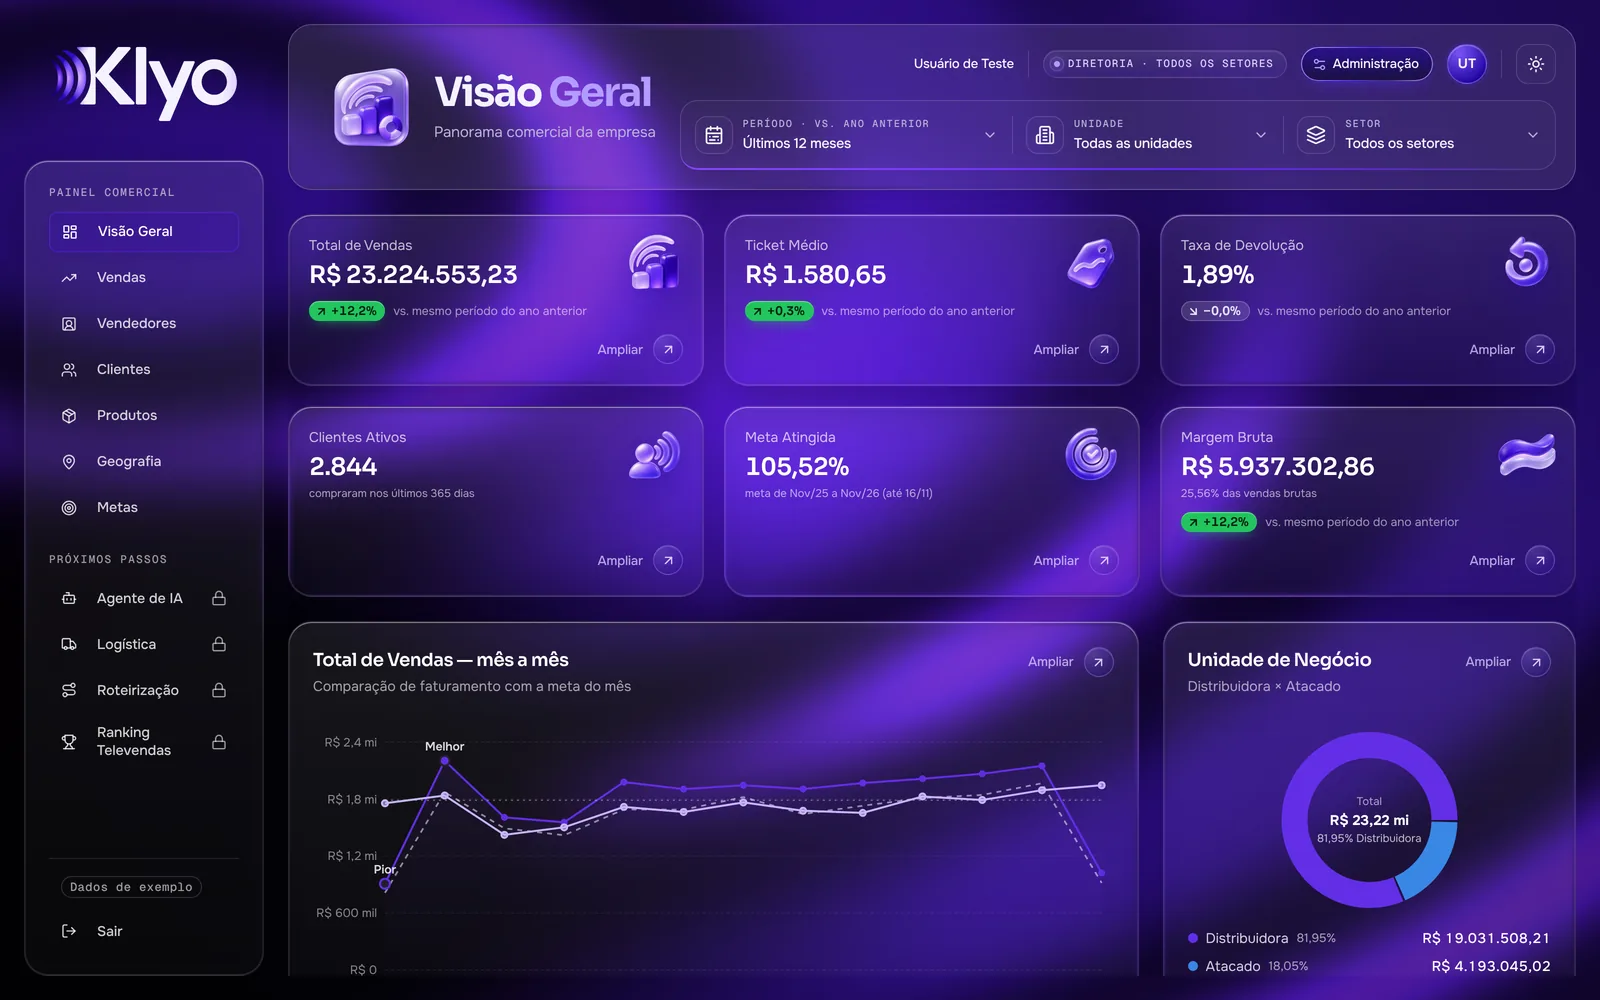
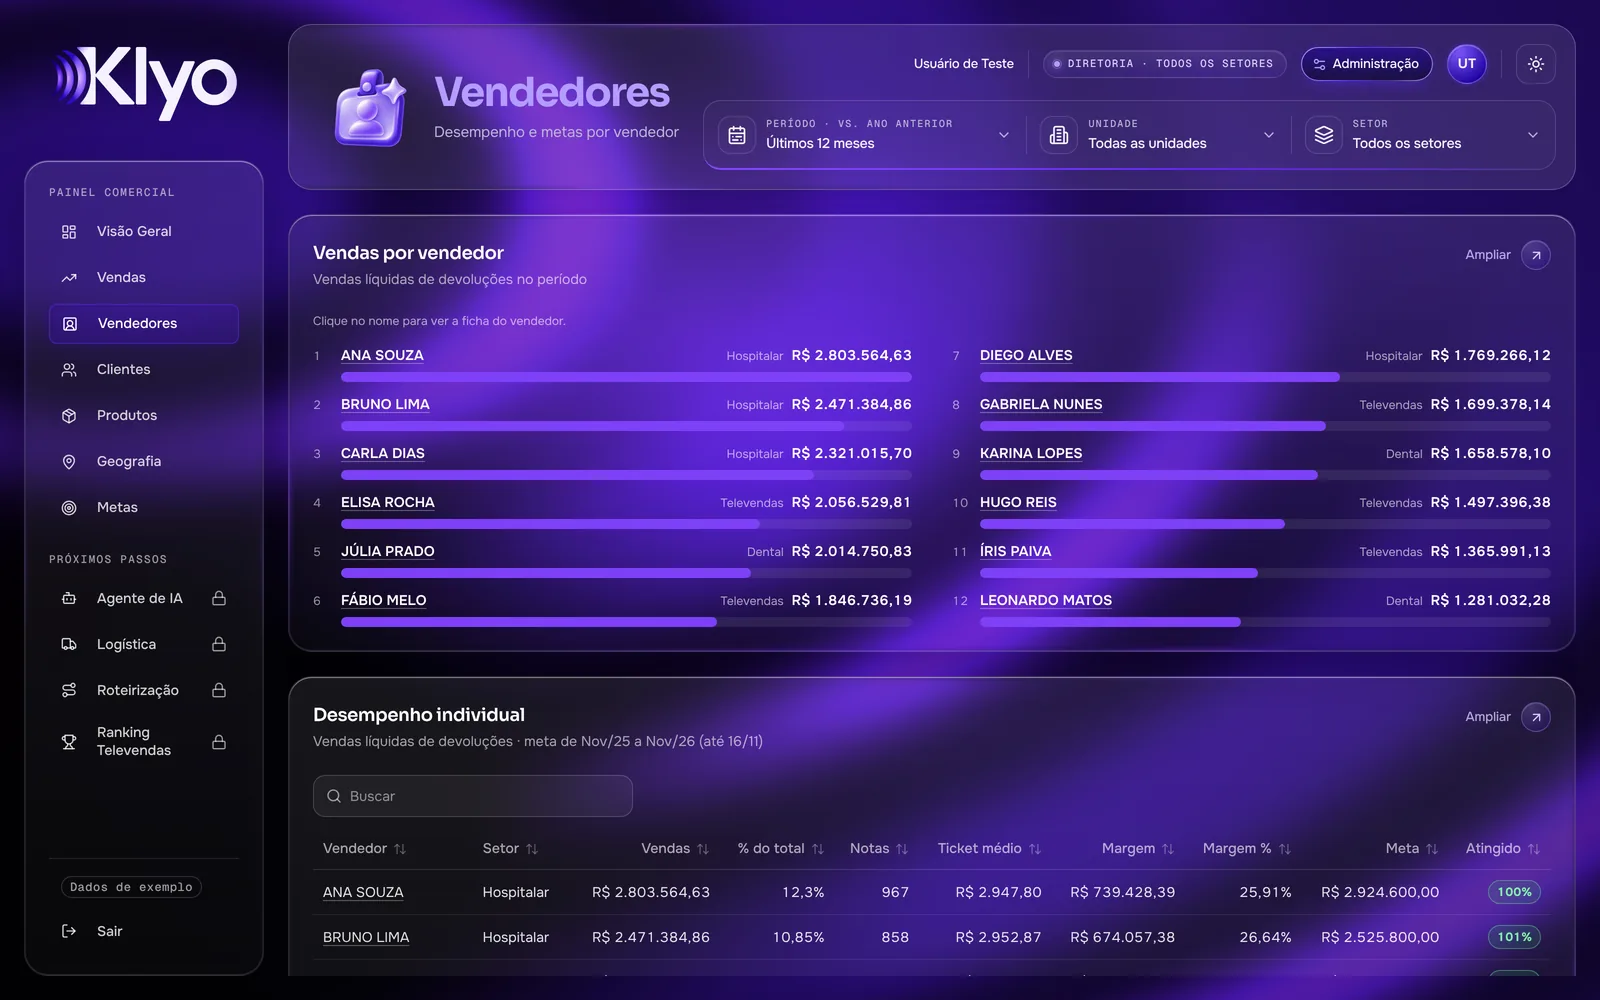
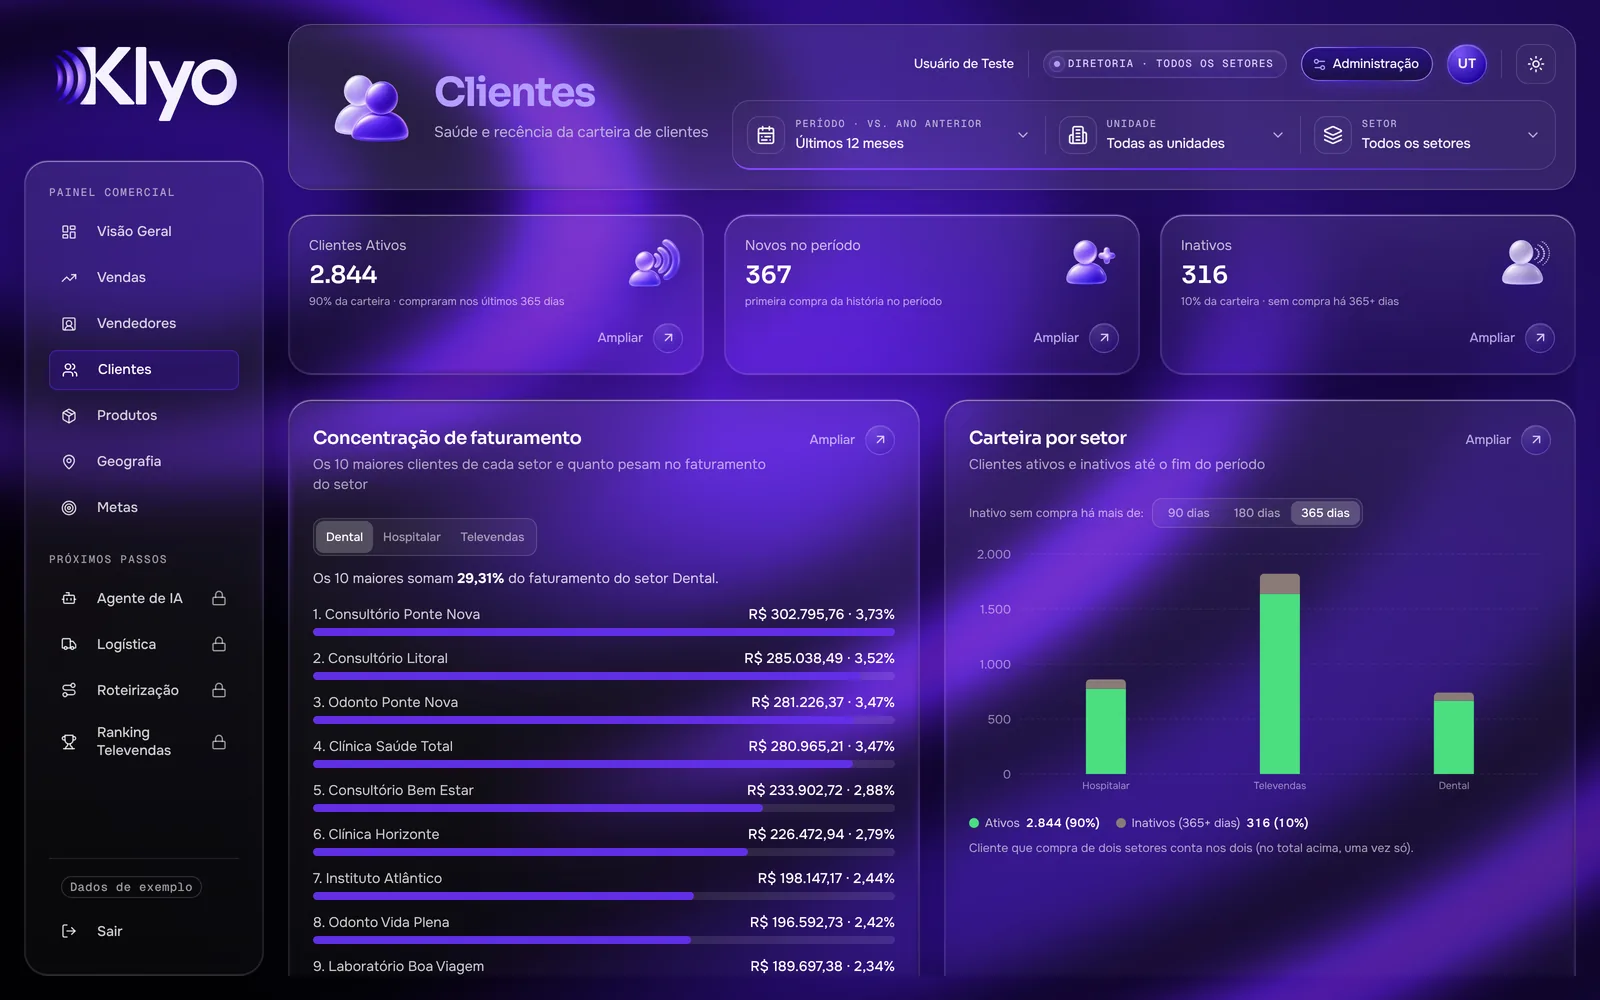
A web platform with seven screens: overview, sales, salespeople, customers, products, geography and targets. Numbers come straight from the company's ERP through a read-only connection limited to the tables needed. The browser never touches the database: requests go through a middle layer that checks the user's login and access level, and sector separation is also enforced in the database queries.
The 14 indicators
Sales
- 01Total sales
- 02Average ticket
- 03Seasonality
- 04Return rate
- 05Unbilled orders
Customers
- 06Revenue concentration
- 07Active and inactive by sector
- 08Purchase recency
- 09New customers
Team, products and targets
- 10Sales per salesperson
- 11Target achievement
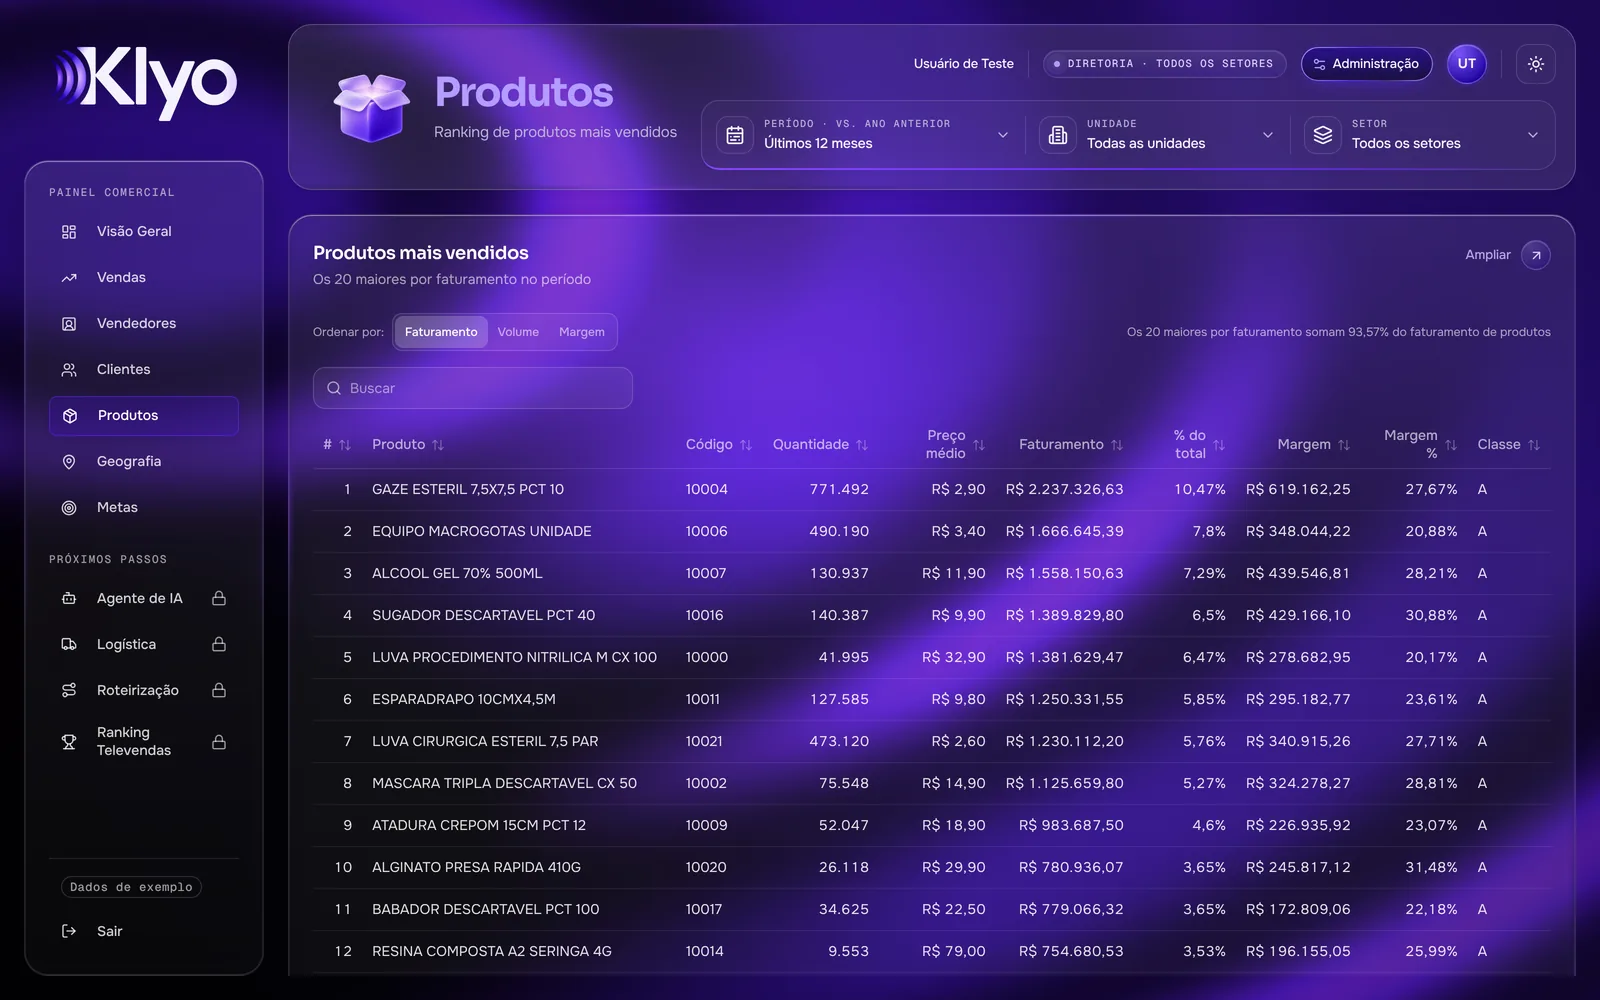
- 12Best-selling products
- 13Gross margin
- 14Geographic distribution
Each indicator opens in an expanded view with its breakdown and an explanation of how the number is calculated.
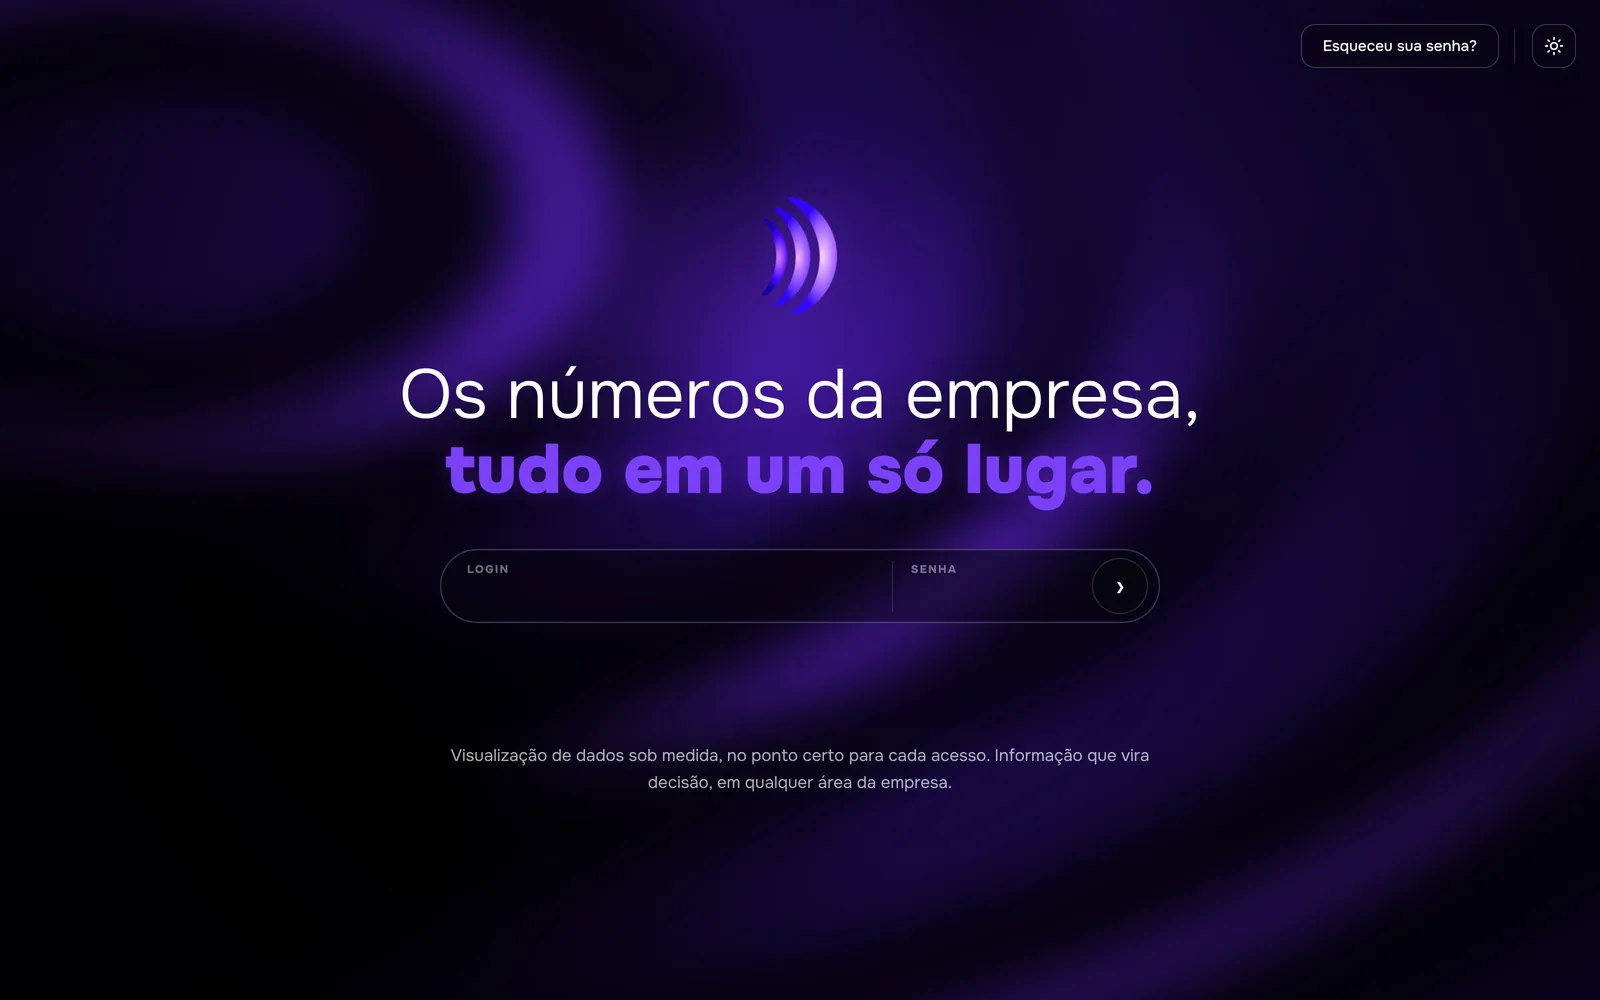
- Sign-in
- Products
- Targets
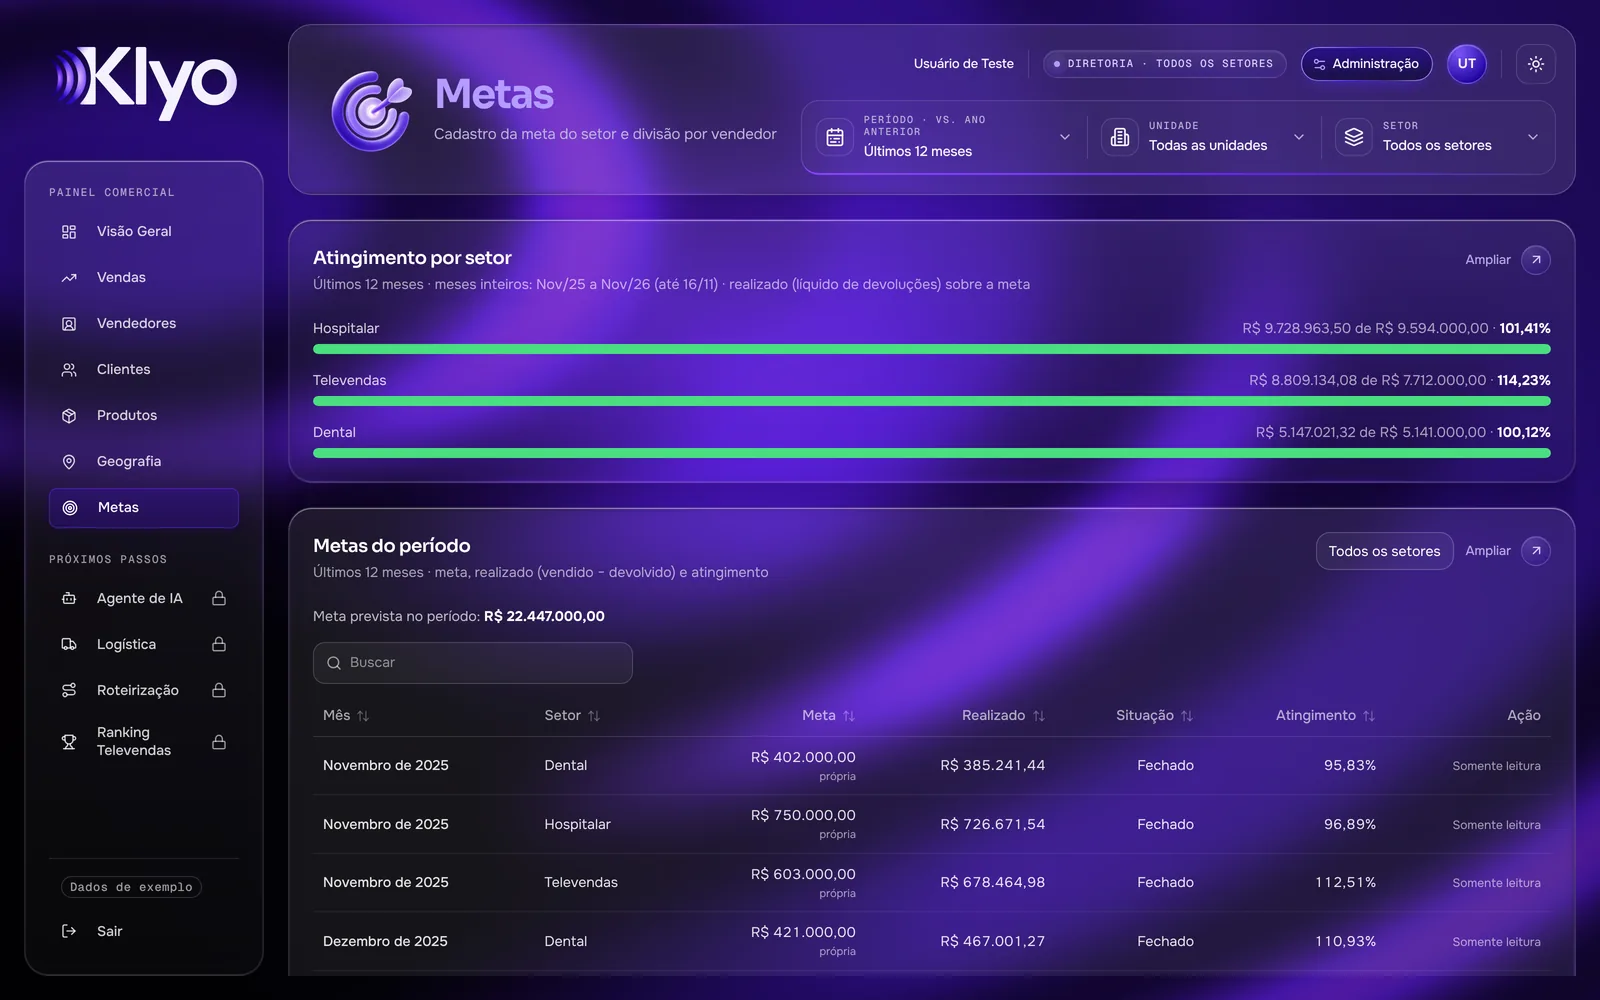
Real screens from the platform, shown with fictitious data and Klyo's colors. The client's version uses their own visual identity.
Delivered beyond the contract
During the project, the client's team asked for adjustments and we proposed others. These were added at no extra cost:
- +01 An admin screen so the company manages its own accounts
- +02 Target setting with projections for the following months
- +03 Individual pages for each salesperson and customer
- +04 Comparison with the previous period and the same period last year
- +05 Margin by sector, salesperson, unit and product, with the calculation breakdown
- +06 ABC product curve
- +07 Sales by business unit
- +08 Sales net of returns
- +09 Customers grouped by days without buying, exportable to Excel
- +10 A PDF report for every indicator
Every indicator was checked against independent database queries and the client team's own reports. When values didn't match, we traced the rule until the difference was explained, and the decisions were recorded in the project documentation. Sector access separation was tested with accounts for each profile before launch.
The platform is in production and the distributor manages its own user accounts. Fixes are covered by the 90-day warranty in the contract. The partnership continued: we are now building a second project with them, focused on logistics (see "What we're building").
What we're building →Want something like this for your company?
Tell us how you track your numbers today.
Recife, Brazil · We also work remotely